
Strategic Policy Branch
Type of resources
Topics
Keywords
Contact for the resource
Provided by
Years
Formats
Representation types
Update frequencies
status
-
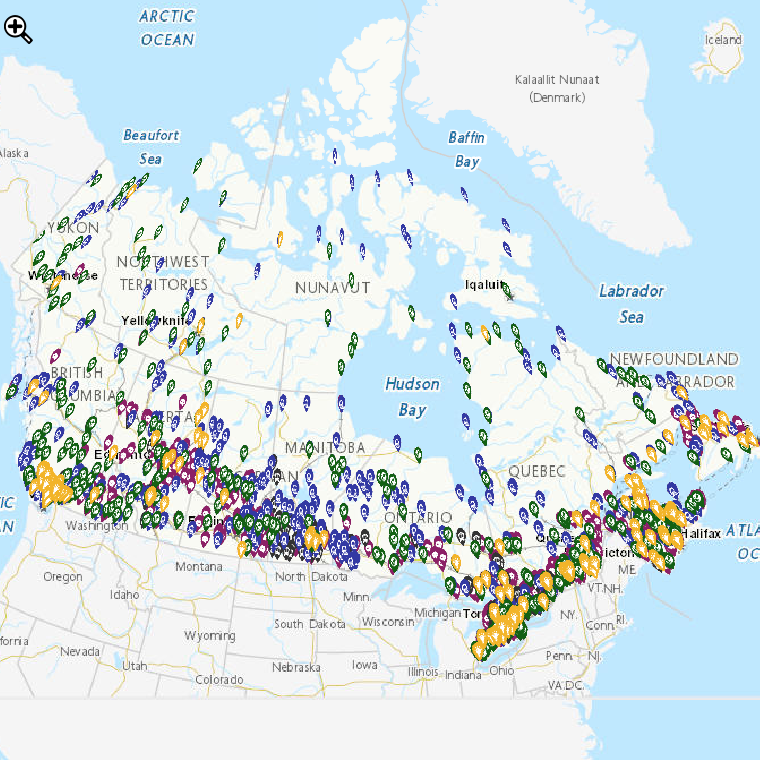
Data describing clean growth and climate change projects that have received federal funding since 2015 that feeds into the Climate Action Map. The data include projects that meet Mitigation, Adaptation and Clean Technology objectives. The data include project names and descriptions, funding information, locations, and recipients.
-
The Canadian Environmental Sustainability Indicators (CESI) program provides data and information to track Canada's performance on key environmental sustainability issues. These indicators present the concentrations of 4 substances (mercury, lead, cadmium and bisphenol A) in Canadians for the periods 2007 to 2009, 2009 to 2011, 2012 to 2013, and 2014 to 2015. Chemical substances are everywhere, including in the air, soil, water, products and food, and can enter the body through ingestion, inhalation and skin contact. Through biomonitoring, the government can identify priorities, develop or revise risk management strategies, and track progress on policies put in place to reduce or control these substances. Information is provided to Canadians in a number of formats including: static and interactive maps, charts and graphs, HTML and CSV data tables and downloadable reports. See the supplementary documentation for the data sources and details on how the data were collected and how the indicator was calculated.
-
The Canadian Environmental Sustainability Indicators (CESI) program provides data and information to track Canada's performance on key environmental sustainability issues. The International comparison of urban air quality indicators compare ambient levels (concentrations) of air pollutants in selected Canadian urban areas with levels in selected international urban areas. The indicators report the concentration of ground-level ozone (as the annual average of the daily maximum 8-hour average), fine particulate matter, sulphur dioxide and nitrogen dioxide (as the annual average of the daily 24-hour average) in ambient air. These indicators are intended to provide a general comparison of ambient levels of air pollutants in selected Canadian urban areas with those measured in other international urban areas. Information is provided to Canadians in a number of formats including: static and interactive maps, charts and graphs, HTML and CSV data tables and downloadable reports. See the supplementary documentation for the data sources and details on how the data were collected and how the indicator was calculated.
-
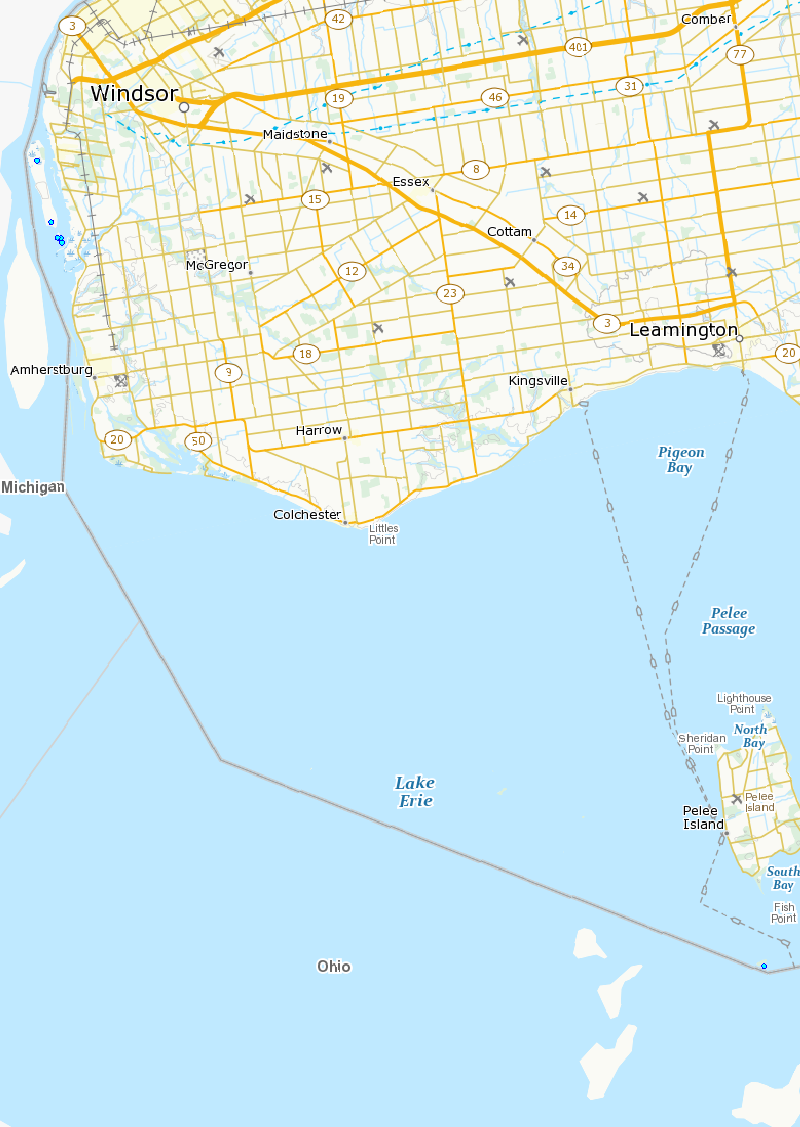
An Area of Concern (AOC) is a location where environmental quality is degraded compared to other areas in the Great Lake Basin resulting in the impairment of beneficial uses. A total of 43 AOCs were identified as a result of Annex 2 of the Great Lakes Water Quality Agreement (GLWQA).The Canada-United States GLWQA identifies 14 beneficial uses that must be restored in order to remove the designation as an Area of Concern. A beneficial use is defined as the ability of living organisms (including humans) to use the Great Lakes Basin Ecosystem without adverse consequences. A Beneficial Use Impairment (BUI) is a condition that interferes with the enjoyment of a water use. Each BUI has a set of locally-defined delisting criteria that are specific, measurable, achievable, and scientifically-defensible. The Remedial Action Plan (RAP) is administered locally in accordance with the Canada-U.S. Great Lakes Water Quality Agreement (GLWQA) and the Canada-Ontario Agreement (COA). The RAP is an ongoing collaborative effort implemented by federal, provincial, and local governments as well as industry and public partners. There are 3 key stages of the RAP: Stage 1 is a detailed description of the environmental problem; Stage 2 identifies remedial actions and options; Stage 3 is the final document providing evidence that the beneficial uses have been restored and the AOC can be “delisted”. The Detroit River, a 51 km-long connecting channel, is one of five binational AOCs. The Detroit River has a long history as a shipping channel and it has contributed greatly to the industrialization and development of Ontario and the north-eastern United States. As a result, however, it has been severely degraded due to frequent dredging, contamination directly into the water or indirectly by atmospheric deposition (i.e. mercury) and through the disposal of human and chemical wastes. For more information, visit detroitriver.ca and/or view a 2010 BUI status update at: https://www.ijc.org/en/detroit-river-status-beneficial-use-impairments
-
The Canadian Environmental Sustainability Indicators (CESI) program provides data and information to track Canada's performance on key environmental sustainability issues. The Water quality in Canadian rivers indicators provide a measure of the ability of river water across Canada to support plants and animals. At each monitoring site, water quality data are compared to water quality guidelines to create a rating for the site. If measured water quality is below the guidelines, it can maintain a healthy ecosystem. Water quality at a monitoring site is considered excellent when parameters in a river very rarely exceed their guidelines. Conversely, water quality is rated poor when parameters usually exceed their guidelines, sometimes by a wide margin. These indicators provide information about the state of surface water quality and its change through time, to support water resource management. Information is provided to Canadians in a number of formats including: static and interactive maps, charts and graphs, HTML and CSV data tables and downloadable reports. See the supplementary documentation for the data sources and details on how the data were collected and how the indicator was calculated.
-
The Canadian Environmental Sustainability Indicators (CESI) program provides data and information to track Canada's performance on key environmental sustainability issues. These indicators present the concentrations of 4 substances (mercury, lead, cadmium and bisphenol A) in Canadians for the periods 2007 to 2009, 2009 to 2011, 2012 to 2013, and 2014 to 2015. Chemical substances are everywhere, including in the air, soil, water, products and food, and can enter the body through ingestion, inhalation and skin contact. Through biomonitoring, the government can identify priorities, develop or revise risk management strategies, and track progress on policies put in place to reduce or control these substances. Information is provided to Canadians in a number of formats including: static and interactive maps, charts and graphs, HTML and CSV data tables and downloadable reports. See the supplementary documentation for the data sources and details on how the data were collected and how the indicator was calculated.
-
The Canadian Environmental Sustainability Indicators (CESI) program provides data and information to track Canada's performance on key environmental sustainability issues. The International comparison: air pollutant emissions in selected countries indicators provide emissions and emissions intensity for member countries of the Organisation for Economic Co-operation and Development. The emissions of 5 pollutants are reported: sulphur oxides, nitrogen oxides, carbon monoxide, volatile organic compounds and fine particulate matter. These indicators help to inform Canadians about how Canada's emissions compare to those of other countries. The indicators report on key air pollutants that contribute to smog and acid rain and help the government to identify priorities, track progress, and develop strategies and policies for reducing or controlling air pollution. Information is provided to Canadians in a number of formats including: static and interactive maps, charts and graphs, HTML and CSV data tables and downloadable reports. See the supplementary documentation for the data sources and details on how the data were collected and how the indicator was calculated.
-
The Canadian Environmental Sustainability Indicators (CESI) program provides data and information to track Canada's performance on key environmental sustainability issues. These indicators present the concentrations of 4 substances (mercury, lead, cadmium and bisphenol A) in Canadians for the periods 2007 to 2009, 2009 to 2011, 2012 to 2013, and 2014 to 2015. Chemical substances are everywhere, including in the air, soil, water, products and food, and can enter the body through ingestion, inhalation and skin contact. Through biomonitoring, the government can identify priorities, develop or revise risk management strategies, and track progress on policies put in place to reduce or control these substances. Information is provided to Canadians in a number of formats including: static and interactive maps, charts and graphs, HTML and CSV data tables and downloadable reports. See the supplementary documentation for the data sources and details on how the data were collected and how the indicator was calculated.
-
Herring gulls are piscivorous and occupy a high trophic level, thus they can accumulate contaminant concentrations attoxic effect levels. Data provided here is part of a larger Great Lakes-wide study that has taken place over four decades. Nest counts and contaminants data for Fighting Island (Detroit River) and Middle Island (Lake Erie) are available. Species include: herring gulls, ring-billed gulls, common tern, black-crowned night-herons. Surveys are on-going, but the gulls have not returned to the Detroit River system since the year 2007.
-
The Canadian Environmental Sustainability Indicators (CESI) program provides data and information to track Canada's performance on key environmental sustainability issues. The Global trends in protected areas indicator reports on global terrestrial and marine area afforded protection for the conservation of nature. The indicator also shows a comparison of area protected among 10 selected countries. Global information on protected areas is collected, analyzed and made available by the World Database on Protected Areas. Information is provided to Canadians in a number of formats including: static and interactive maps, charts and graphs, HTML and CSV data tables and downloadable reports. See the supplementary documentation for the data sources and details on how the data were collected and how the indicator was calculated.